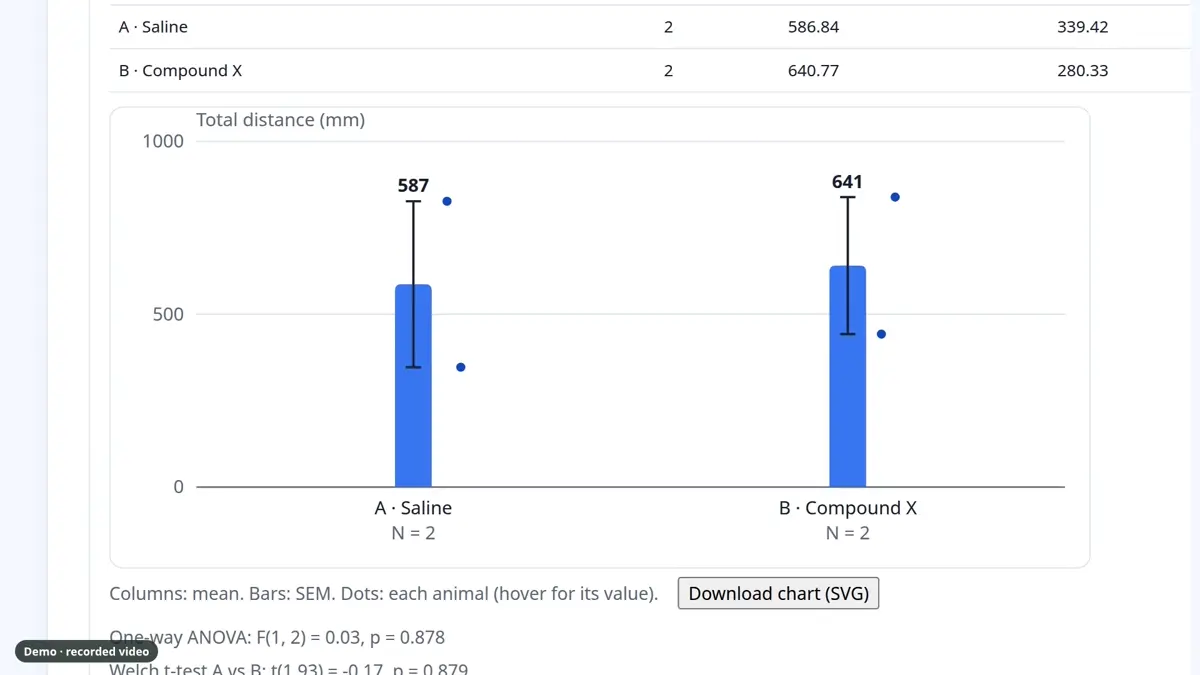
- Total distance travelled, for the test and per minute
- Time in centre and in periphery
- Entries into the centre zone and latency to the first entry
- Active time
- The track and the video of each test, to check before you export
- Per-group reports and exportable charts
- A dataset export ready for your statistics
Open field test
Open field results in minutes,
not afternoons.
Run your open field tests and get distance, centre and periphery time, zone entries and activity for every animal as soon as each test ends, ready to export for your statistics. Measures validated against manual scoring.
Forty seconds, one test
An open field test, from Start to the report.
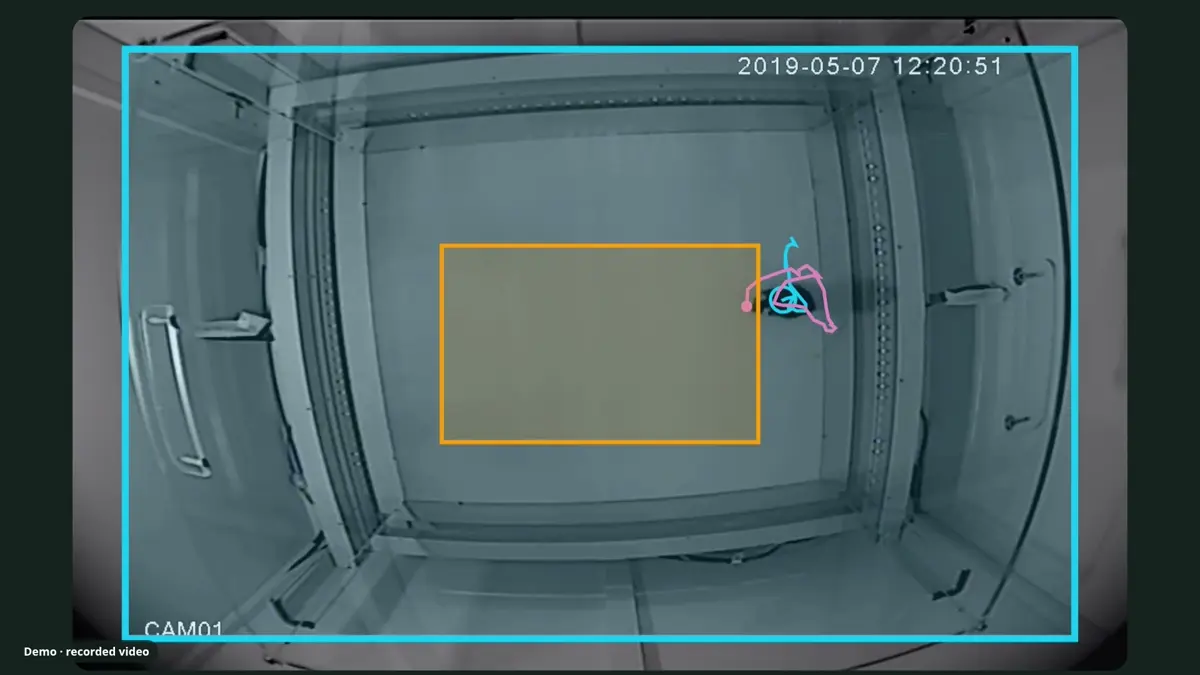
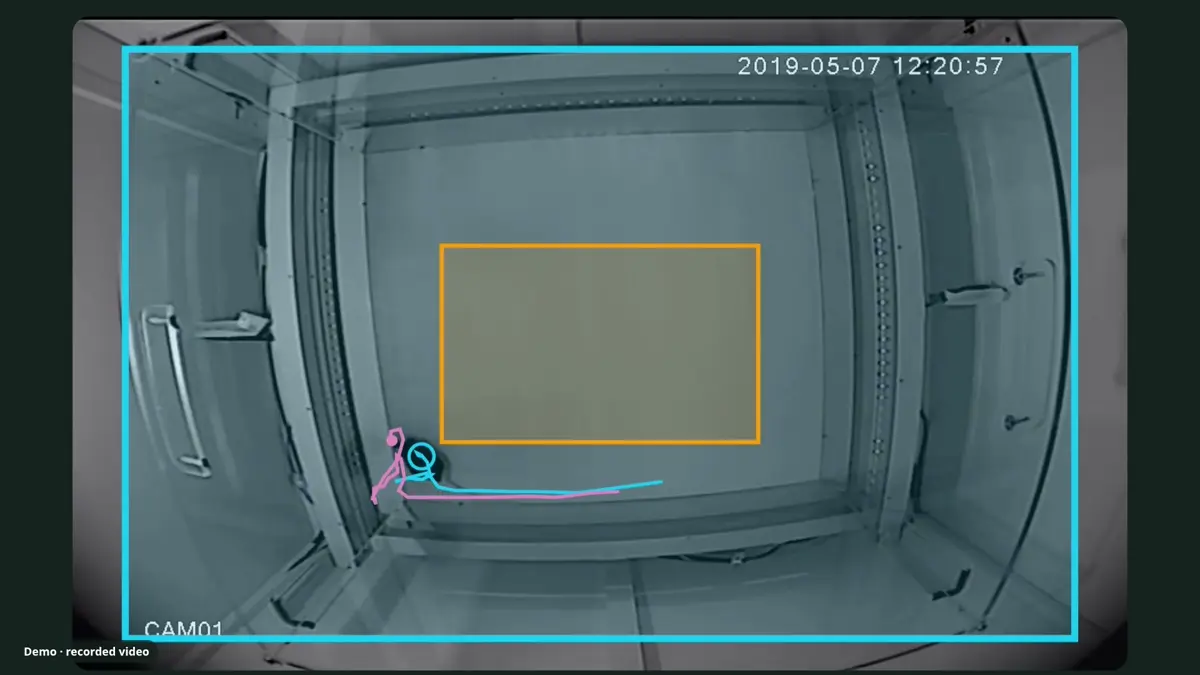
The arena and its centre zone are drawn for you, the mouse is followed through every second, and the report is waiting when you press Stop.
What the open field tells you
- Distance travelled. The length of the whole path, for the test and per minute, to see habituation within the session.
- Time in the centre and in the periphery. The classic anxiety-like measure: a mouse that keeps to the walls spends little time in the dashed square.
- Entries into the centre. Each crossing into the centre zone is counted, with the latency to the first one.
- Active time. Time spent moving versus staying still, per animal and per group.
Why labs choose it for open field
Locomotion and anxiety-like behavior in one report
Distance sits next to time in the centre and in the periphery, for every animal and every group, so a sedative effect is never mistaken for an anxiolytic one.
Four open fields on one camera
Test four animals at once, with the same arena drawn for each, and no extra equipment.
Same settings, every time
Save the protocol once and reuse it for every cohort, so results stay comparable across weeks and people.
The animal, the arena, the station
Run it well
Before the session
Let the animals settle in the testing room for 30 to 60 minutes. Test at the same time of day for every cohort; activity changes with the light cycle.
The arena
A uniform floor that contrasts with the coat, even lighting without reflections, and a centre zone you keep identical for the whole study. Clean between animals.
The test
Place the animal in the same spot each time, step back and press Start. Five to ten minutes is the usual duration; the results per minute show the habituation.
From the test to the figure
Describe the cohort
Animals and treatment groups in a grid; the open field protocol is ready to use.
Draw the arena once
The arena and its centre are placed on the image of your own apparatus and kept for every cohort.
Start, test, next animal
One Start per animal and arena, the queue of planned animals on the station screen.
Results and export
Distance, centre and periphery time, entries and activity per animal; groups compared on a chart; dataset exported.
Common questions
What does the open field analysis measure?
Distance, time and entries in the centre and periphery, and active time, for every animal in every arena.
What does time in the centre tell me?
An anxious animal stays along the walls; a treatment that reduces anxiety-like behavior increases the time and the entries in the centre. Distance tells you whether locomotion itself changed, which is why the two sit side by side in the report.
How many animals can I test at once?
Up to four open fields on one camera, one animal in each.
Does the arena have to be a particular size or colour?
No. Square or round, white or grey, 40 cm or 1 m: you draw the arena on the image of your own apparatus and the centre zone is placed for you. We advise on floor contrast and lighting during the demo.
Can I change the centre zone after the tests?
Yes. Change the zone or a threshold and the results are recomputed in seconds, without running the animals again.
Can I compare treatment groups?
Yes. Reports are organized by treatment, with charts you can export.
How do I see it before I decide?
Request your free demo: you run a simulated open field test and see its results.
Keep exploring
Request your free demo and see the results of a simulated test.